Board-Level Cloud and Data Center ROI: Governing the Full Technology Estate in 2026
Cloud waste runs at 29-35% of spend. GPU idle time hits 30-60%. Data center costs surpass $650B in 2026. Here is the board-level governance framework that connects every infrastructure dollar to measurable business value.
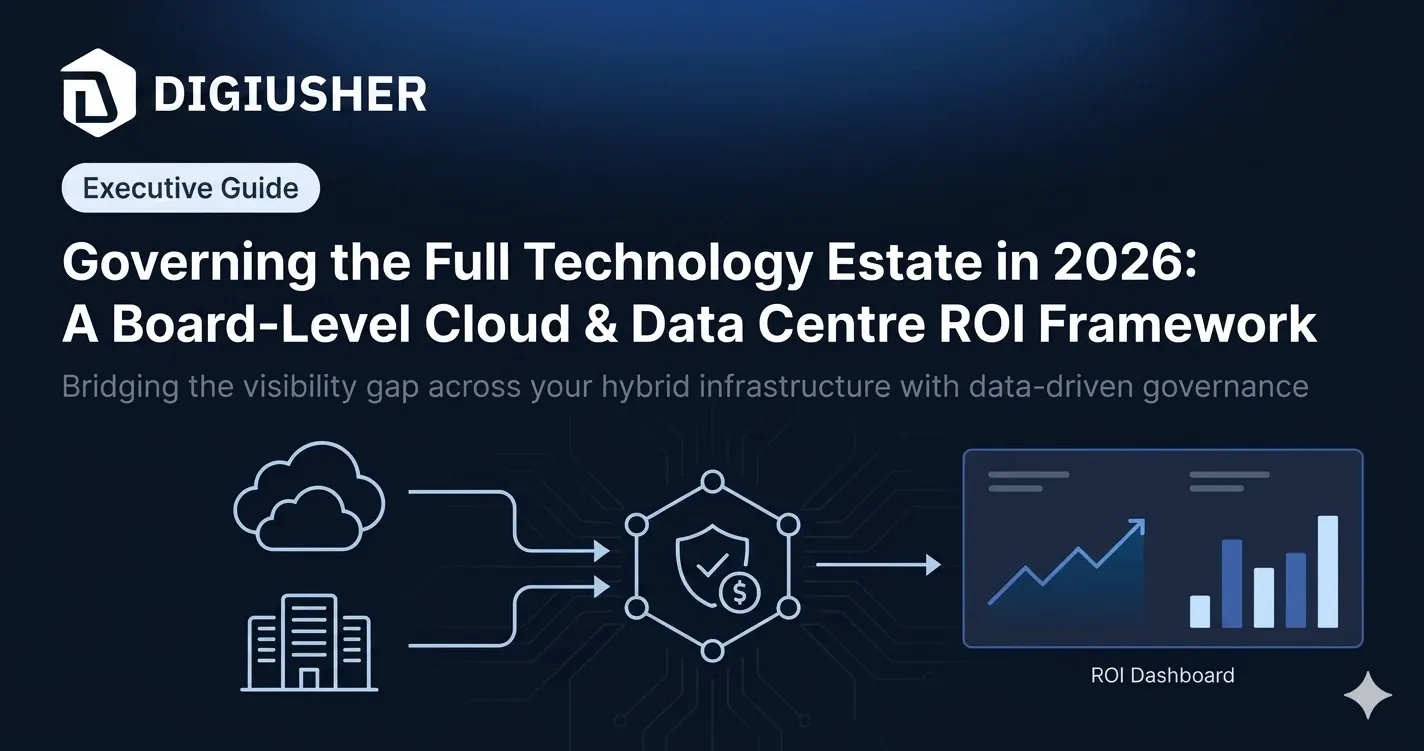
Cloud waste runs at 29-35% of spend. GPU idle time hits 30-60% on most enterprise ML pipelines. Data centre spending is crossing $650 billion globally in 2026. And the vast majority of enterprise boards receive a financial report that covers, at best, the public cloud bill.
The governance gap between what enterprises invest in technology infrastructure and what they can account for at board level has never been wider, because the estate has never been more complex — public cloud across five or more hyperscalers, Kubernetes clusters running on two or three of them, Nvidia GPU hardware in company-owned data centres, rack space in third-party colocation, and private cloud infrastructure carrying workloads that never completed migration. Every category is growing, each carries its own cost behaviour and depreciation profile, and in most large enterprises only one of them — public cloud — has anything approaching board-level financial governance. Gartner’s 2026 forecast projects total data centre spending increasing 31.7%, surpassing $650 billion, up from nearly $500 billion the year before, with server spending accelerating 36.9% year-over-year. These are capital deployment numbers audit committees govern for any other asset class on the balance sheet. The real question is why the governance architecture for technology infrastructure hasn’t kept pace with the capital commitment it’s meant to account for.
The full-estate accountability problem
The average large enterprise in 2026 operates across at least four structurally different cost categories: public cloud, private cloud or owned data centre, third-party colocation, and AI/GPU hardware existing in combinations of all three — each with a different capital structure, cost-per-unit behaviour, depreciation treatment, and waste profile. A CFO governing only the public cloud bill is answering a partial question, and boards are increasingly aware of the gap.
The FinOps Foundation’s State of FinOps 2026 confirms the structural shift: what was once a cloud-focused practice is now definitively multi-technology, with AI management near-universal at 98%, private cloud at 57% (up 18 points), licensing at 64% (up 15), data centre at 48% (up 12), and an emerging 28% beginning to include labour cost. FinOps is now firmly anchored in technology leadership, with 78% of practices reporting into the CTO/CIO organisation, up 18 points since 2023 — an expansion arriving from the top, not a community trend. The Foundation’s 2026 Framework introduced Executive Strategy Alignment as a new capability connecting technology value to business strategy directly, formalising FinOps as the technology value management function boards actually need for capital allocation, rather than a cost-cutting discipline for engineering teams.
Technology Value Management is the discipline of governing the full technology cost surface — public cloud, private cloud, owned data centres, colocation, GPU hardware, SaaS, and AI workloads — as a single integrated capital portfolio with consistent attribution, unit economics, and board-level ROI accountability across every category. It’s the maturation of FinOps from a cloud-cost optimisation practice into a strategic financial governance function connecting every technology investment to a measurable outcome, letting CFOs and boards make capital allocation decisions with the same rigour applied to any other material asset class. The governance challenge isn’t that boards are asking new questions — it’s that the estate has expanded faster than the financial infrastructure built to account for it.
What cloud waste actually costs at board scale
Cloud waste is one of the most widely cited statistics in enterprise technology management and one of the least acted upon, largely because it’s usually presented as a utilisation metric rather than a financial impact. Adoption of dedicated FinOps teams has climbed to 63%, and Cloud Centres of Excellence are now present at 71% of organisations — yet the waste rate itself sits at around 29% of IaaS and PaaS spend, a figure that’s hovered between 27% and 32% since 2019. A separate survey of 475 senior leaders puts the figure at 35%, noting the decline in efficiency isn’t a laggard problem — the top quartile of operators moved in the same direction. One industry estimate puts global infrastructure cloud waste at roughly $44.5 billion, driven by a persistent gap between FinOps strategy and developer behaviour.
That persistence despite real FinOps investment is structural, not operational. Most cloud cost platforms govern the resources they can see — tagged resources in well-governed accounts. Shadow IT, developer-deployed resources bypassing cost allocation, and Kubernetes workloads with no namespace attribution keep generating waste outside the governance perimeter entirely, and that waste doesn’t appear in a weekly optimisation report — it appears in the quarterly cloud bill as a number nobody can fully explain to an audit committee. For a board, that’s an accountability gap no volume of rightsizing recommendations resolves: cutting cloud cost from £40M to £36M is a 10% improvement in a number the CFO still can’t fully account for, and it says nothing about what the remaining £36M is actually returning.
The metric that changes the board conversation isn’t the waste percentage — it’s attribution coverage: the proportion of total cloud spend assigned to a responsible cost owner with a unit economics target. Organisations using structured FinOps frameworks are 2.5x more likely to meet or exceed their cloud ROI expectations, and the differentiator isn’t spending less — it’s spending with accountability at the workload and business-unit level.
FinOps Cloud+ is the operational model extending FinOps practices — attribution, unit economics, anomaly detection, chargeback, commitment management, waste elimination — beyond public cloud to cover the full estate: private cloud, owned data centres, colocation, GPU hardware, SaaS, AI workloads, and marketplace transactions. It recognises that boards hold CFOs accountable for total technology spend, not just the public cloud bill, which makes single-scope governance structurally insufficient for 2026 board reporting. In practice that means ingesting and normalising cost data from fundamentally different billing formats — hyperscaler exports, colocation invoices, depreciation schedules for owned hardware, power and cooling data from building management systems, and GPU utilisation telemetry — into one model; without that normalisation (FOCUS provides the standard at the specification level), cross-category unit economics comparison stays manual, inconsistent, and impossible to present with confidence at board level.
Data centres: the governance blind spot most estates carry
Owned data centres and third-party colocation represent a fundamentally different financial management challenge than public cloud, and in most large enterprises they’re governed with meaningfully less rigour than the cloud infrastructure sitting right alongside them. Public cloud spend is opex flowing through the P&L monthly, visible in a dashboard, alerting on deviation from forecast. Owned data centres carry capital assets — servers, networking, power and cooling — sitting on the balance sheet with multi-year depreciation, plus operational cost (power, maintenance, staffing) landing in a facilities budget rather than a technology one. The cost of running a workload there is never a single number the way a cloud instance is; it needs an allocation model spanning depreciation, power, cooling, physical space, connectivity, and staffing — and most FinOps functions haven’t built that model.
Colocation sits between the two extremes: the enterprise owns its hardware but pays the facility for power, cooling, physical security, and connectivity. Rack space adds $1,000-5,000 a month for a four-to-eight-GPU system, and an 8-GPU H100 cluster in high-density configuration needs multiple racks — at typical rates, that’s $48,000-480,000 a year in facility cost alone, before hardware, networking, staffing, or software are even counted, and it rarely appears in any FinOps governance report. The cloud team reports on cloud spend, the facilities team reports on data centre operating costs, and the two numbers never appear in the same financial model — so a board wanting to know whether a workload should run on cloud or in the company’s own data centre can’t get a defensible answer, because nobody’s built the model making the two environments comparable on a unit-economics basis.
Owned data centres carry the full ownership burden and their main governance risk is stranded capacity — hardware bought for projected growth that didn’t materialise, or partially migrated to cloud with the underlying physical infrastructure never fully decommissioned; enterprises that migrated aggressively between 2020 and 2024 frequently found owned data centre costs didn’t materially fall, because fixed infrastructure cost continues regardless of server utilisation. Colocation offers more flexibility while retaining equipment control cloud doesn’t, with its main risk being contractual commitment to rack space and power capacity that may not match actual utilisation, plus the same depreciation exposure on owned servers, compounded by egress cost whenever data moves between the facility and cloud services. And GPU hardware in either environment creates a distinct challenge, combining the highest capital cost per unit of any enterprise computing hardware with the most variable utilisation profile of any workload category — a single 8x H100 SXM5 server carries a three-year TCO between roughly $712,000 and $948,000, with staff cost alone accounting for $225,000-300,000 over three years for half an FTE of infrastructure engineering time. At that capital commitment per server, GPU idle time isn’t a utilisation metric. It’s a capital destruction figure that belongs in the board report.
The Nvidia GPU capital decision
The decision to own versus rent Nvidia GPU hardware is arguably the most consequential technology capital allocation question most large enterprises will face this year, and it’s also one of the most commonly made without adequate financial modelling. The case for owning is genuinely compelling under the right conditions — on-premises infrastructure can deliver up to an 18x cost advantage per million tokens against Model-as-a-Service APIs for sustained, high-utilisation workloads, with roughly $3.4M in five-year operational saving once the hardware’s paid off, compared to equivalent sustained cloud usage.
The catch is that “sustained, high-utilisation” is harder to achieve than most GPU capital proposals acknowledge. The break-even threshold for owning sits above 60-70% sustained utilisation; below that, cloud rental is almost always cheaper once operational overhead is factored in — and idle GPU time runs at 30-60% for most ML pipelines, which materially deteriorates the on-premises economics once it’s actually included in the TCO calculation. The market has also moved significantly: AWS cut H100 pricing on P5 instances 44% in June 2025, from roughly $7.57 to $3.90 per GPU-hour, with GCP and Azure following with comparable cuts — on-demand H100 rental across the three major hyperscalers now ranges $3.00-6.98 per GPU-hour as of April 2026. Any enterprise making an ownership decision on 2024 cloud pricing is using stale inputs that structurally favour the on-premises case against a market that’s since moved.
GPU TCO Decision Framework: Board-Ready Cost Comparison
─────────────────────────────────────────────────────────────────────────
Configuration: 8x H100 SXM5 server cluster
─────────────────────────────────────────────────────────────────────────
OWNED HARDWARE (3-Year TCO, fully loaded)
─────────────────────────────────────────────────────────────────────────
Hardware acquisition (8x H100 SXM5 server)       $711,950-$947,730
Colocation facility costs (est. 3yr)             $144,000-$432,000
  - Rack space ($1,000-$5,000/rack/month)
  - Power and cooling (700W/GPU x 8)
Engineering operational overhead                  $225,000-$300,000
  - 0.5 FTE infrastructure engineering (3yr)
NVMe storage + InfiniBand networking              +30-50% HW cost Yr1
─────────────────────────────────────────────────────────────────────────
TOTAL 3-YEAR OWNED TCO (est.)                    ~$1.1M-$1.7M
─────────────────────────────────────────────────────────────────────────
CLOUD RENTAL (3-Year at April 2026 market rates)
─────────────────────────────────────────────────────────────────────────
Hyperscaler on-demand (avg ~$4.50/GPU-hr, 24/7)  ~$951,120 (3yr)
Reserved 1-year commitment (30-40% discount)      ~$570,000-$665,000
Specialized GPU provider (~$2.50/GPU-hr, 24/7)   ~$526,000 (3yr)
─────────────────────────────────────────────────────────────────────────
BREAK-EVEN UTILIZATION THRESHOLD
─────────────────────────────────────────────────────────────────────────
Owned hardware becomes cost-competitive:          >60-70% sustained util.
Typical enterprise GPU idle rate:                 30-60%
─────────────────────────────────────────────────────────────────────────
BOARD QUESTION: What is the current GPU fleet utilization rate?
If below 60%, the ownership case requires scrutiny at board level.
─────────────────────────────────────────────────────────────────────────
The board governance requirement isn’t to pick one model — it’s to make the choice with a defensible, utilisation-grounded financial model rather than a procurement preference. An enterprise that bought GPU hardware based on projected utilisation it never achieved is carrying a capital position that doesn’t match its own financial case, and that discrepancy needs surfacing at board level rather than quietly managed through a utilisation-improvement target buried somewhere in a technology roadmap.
Three cost categories are routinely excluded from enterprise GPU TCO models, and their exclusion is the main reason those models underestimate long-term cost. Data egress is the first — when training data lives in cloud object storage and inference results return to cloud applications, an on-prem or colocation GPU cluster incurs transfer cost between the facility and the cloud environment; AWS egress above 10TB/month runs $0.09/GB, so 1PB of transfer generates roughly $92,000 a year, and this line item appears in essentially no GPU hardware procurement proposal. Hardware obsolescence is the second — newer-generation GPUs already deliver two to 2.5x the performance of the H100 for LLM training, and as they gain availability, H100 pricing keeps falling; an enterprise that committed to owned H100 hardware on a five-year depreciation schedule is holding hardware whose cloud-equivalent cost drops every quarter, meaning the ownership premium grows over the asset’s life rather than shrinking. And lock-in cost is the third — 45% of IT leaders report vendor lock-in has already prevented them adopting better tools, and for GPU infrastructure that manifests as CUDA dependencies and framework choices optimised for a specific hardware generation, making migration expensive enough to defer even once the financial case for it is clear.
A five-part framework for board-ready infrastructure reporting
The board report a CFO needs for a $650 billion infrastructure market can’t be the public cloud bill with data centre cost appended as a footnote. It needs a framework making every infrastructure category comparable through unit economics, identifying waste in each category separately, and supporting the workload placement decisions that determine whether capital lands on the right infrastructure type.
A full estate cost inventory, where every category — public cloud, private cloud, owned data centre, colocation, GPU hardware — appears in the same financial model, normalised to a consistent unit of analysis through a FOCUS-compatible schema rather than left in its native billing format, so “what does it cost to run Product X” has a defensible answer across every layer it runs on.
Cross-category unit economics, calculated with the same methodology for every category — cost per transaction, per application, per workload hour — so a board can compare public cloud against colocation against owned hardware on a like-for-like basis: a workload on owned GPU hardware at 40% utilisation set against the same workload on reserved cloud capacity at current market rates, with the board able to see which placement is actually generating the better return.
Waste quantification by category, broken out rather than aggregated into a single percentage:
Full Estate Waste Quantification: Board Reporting Template
─────────────────────────────────────────────────────────────────────────
CATEGORY          WASTE TYPE              QUANTITY    IMPACT    PRIORITY
─────────────────────────────────────────────────────────────────────────
Public Cloud      Idle compute             XX%        £X.XM     High
                  Over-provisioned         XX%        £X.XM     High
                  Untagged / ungoverned    XX%        £X.XM     Critical
Private Cloud     Stranded capacity        XX%        £X.XM     Medium
                  Shadow workloads         XX%        £X.XM     High
Owned DC          Unused server racks      XX%        £X.XM     Medium
                  Stranded post-migration  XX%        £X.XM     High
Colocation        Unoccupied rack space    XX%        £X.XM     Medium
                  Idle GPU capacity        XX%        £X.XM     Critical
GPU Hardware      Fleet idle time          XX%        £X.XM     Critical
                  Model / token waste      XX%        £X.XM     High
─────────────────────────────────────────────────────────────────────────
TOTAL WASTE EXPOSURE                                  £XX.XM
  of which: Immediately recoverable                   £XX.XM
  of which: Structural / architecture-driven          £XX.XM
─────────────────────────────────────────────────────────────────────────
Presenting waste this way gives a board a genuine prioritisation framework rather than one percentage — separating recoverable waste (idle instances, over-provisioning) from structural waste (an architecture decision needing remediation rather than optimisation) is the difference between a short-term P&L recovery and a medium-term investment decision, and both belong in the report, kept separate rather than blended together.
Workload placement analysis turns the “should this run on public cloud, private cloud, owned data centre, or colocation” question — usually answered as an engineering matter — into a financial one, using cross-category unit economics to assign each workload type to its optimal placement at current market rates:
| Workload Category | Cloud | Private / Colo | Owned Hardware |
|---|---|---|---|
| Elastic, variable demand | Optimal | Consider reserved | Over-committed capital |
| Steady-state, predictable | Reserved | Optimal | Fine if utilisation >60% |
| Regulated data perimeter | Sovereign cloud | Preferred | Preferred |
| GPU training (bursty) | Optimal | Partial fit | Idle cost between runs |
| GPU inference (high volume) | Reserved | Fine if utilisation >60% | Fine if utilisation >60-70% |
| Dev / test / experimental | On-demand / spot | Over-committed | Capital waste |
This framework isn’t static — the June 2025 H100 price cut changed the economics for GPU inference workloads, and new GPU generations arriving at two to 2.5x the price-performance change the obsolescence calculation for owned commitments. Placement decisions made on 2024 data need re-evaluating against current market rates, and that re-evaluation belongs on the calendar as a scheduled governance activity, not left to ad hoc engineering review.
Attribution coverage as a leading board KPI — the proportion of total technology spend assigned to a responsible cost owner with a quantified unit economics target is the clearest leading indicator of Technology Value Management maturity. Mature practices focus on value capabilities (unit economics, AI value quantification, influence over technology selection) rather than cost reduction alone, and formalising attribution coverage as a board KPI is what shifts the conversation from a cost-reduction target to a genuine investment-accountability metric.
Every infrastructure capital decision reduces to one question: is this asset deployed where it generates the best risk-adjusted return at current market rates? Technology Value Management is the governance discipline that answers that, across every category, every quarter, in the language a board actually needs.
See what a full-estate view looks like across your own cloud, data centre, and GPU infrastructure. Book a 30-minute session and we’ll map real workload placement and GPU utilisation against what you’re actually running. Request a demo →
Frequently asked questions
What is board-level cloud and data centre ROI, and why does it matter in 2026? It’s the financial accountability discipline where an organisation demonstrates, at board level, that its full technology infrastructure investment generates a return commensurate with the capital deployed. With total data centre spending projected to exceed $650 billion in 2026, up 31.7% year-on-year, infrastructure spend meets the materiality test for board-level capital governance — and a CFO without a unified Technology Value Management view is answering only a partial version of the board’s real question.
How much cloud spend is typically wasted in a large enterprise? Roughly 29% of IaaS and PaaS spend by one measure, with another survey putting it as high as 35% — a figure that’s held steady since 2019 despite real FinOps investment. That persistence reflects a governance architecture gap rather than an optimisation failure: FinOps teams govern the spend they can see, while significant portions of the estate remain outside the attribution perimeter entirely. Organisations with structured FinOps frameworks are 2.5x more likely to meet or exceed their cloud ROI expectations.
When does owning Nvidia GPU hardware actually deliver better ROI than renting it? On-premises GPU infrastructure can deliver up to an 18x cost advantage per million tokens for sustained, high-utilisation workloads — but the break-even threshold sits above 60-70% sustained utilisation, and idle GPU time runs 30-60% for most ML pipelines. A significant June 2025 price cut also dropped hyperscaler H100 rental roughly 44%, so any ownership decision still using 2024 cloud pricing comparisons is working from stale inputs that structurally favour ownership against a market that’s since moved.
What’s the difference between owned data centres, colocation, and cloud for board governance purposes? Owned data centres carry capital assets on multi-year depreciation with fixed cost continuing regardless of utilisation, making stranded capacity the primary risk. Colocation provides facility infrastructure while the enterprise retains hardware ownership, with contractual commitment to unused capacity as the primary risk. Cloud is pure opex with maximum elasticity, but persistent 29-35% waste as its own risk. A genuine board-ready framework governs all three separately, with placement decisions driven by cross-category unit economics rather than engineering preference.
What is FinOps Cloud+, and what does it require operationally? It’s the model extending FinOps governance practices beyond public cloud to cover private cloud, owned data centres, colocation, GPU hardware, SaaS, and AI workloads together. It needs a FOCUS-normalised data model making unit economics genuinely comparable across categories, attribution assigning cost to a responsible owner everywhere, waste quantified by category and type, cross-category workload placement analysis, and attribution coverage tracked as a leading board KPI rather than an afterthought.
References
- Gartner — Gartner Forecasts Worldwide IT Spending to Grow 10.8% in 2026
- FinOps Foundation — State of FinOps 2026
- FinOps Foundation — FinOps Framework 2026 Update
- CloudZero — 100+ Cloud Computing Statistics: A 2026 Market Snapshot
- GMI Cloud — NVIDIA H100 GPU Pricing 2026: Rent vs. Buy Cost Analysis
- CIO.com — Why Cloud Repatriation Is Back on the CIO Agenda
- NVIDIA — Rethinking AI TCO: Why Cost Per Token Is the Only Metric That Matters
Related reading
- Board-Level AI ROI: Why $600B in Investment Is Delivering Single-Digit Returns — and What Fixes It — May 21, 2026
- Why FinOps Is Now a Board-Level Responsibility — April 2, 2026
- Cloud Cost Optimization Is Dead. Long Live Technology Value Management — May 5, 2026
- GPU Cost Governance for Azure OpenAI, AWS Bedrock & Google Vertex AI — March 19, 2026
© 2026 DigiUsher. All rights reserved. Privacy Policy · Terms of Service · Trust Center
DigiUsher in 15 min
Give your board a cost-to-outcome view they can actually act on.
DigiUsher connects cloud and AI spend to the outcomes it funds, in language finance already speaks.
Book my 15-min discovery callNo hard pitch · specific to your stack
Continue Reading
More from the DigiUsher editorial team.
Seven Signals from the State of FinOps 2026: Why Technology Value Management Is Now a Board-Level Mandate
8% of FinOps teams now govern AI spend. Gartner forecasts $2.52T in global AI investment. The State of FinOps 2026 rewrites the rules for every CTO, CFO, and Head of FinOps.
Why DigiUsher Rebuilt Its Cost Engine on FOCUS — and Why That Decision Is Now an Enterprise Advantage (Blog 3/5 Series)
In 2023, DigiUsher bet its platform architecture on FOCUS before hyperscalers committed to it. Here is why that decision was made, what it cost, and what it delivers.
Board-Level AI ROI: Why $600B in Investment Is Delivering Single-Digit Returns — and What Fixes It
Only 7% of CFOs see high ROI from AI despite $270B in enterprise spend forecast for 2026. Here's the governance framework boards are demanding — and why cost attribution is the missing layer.