Product Update — May 2026: Everywhere Your Spend Lives
A wrap-up of the May 2026 of DigiUsher releases — three new data sources (Anthropic, Databricks, Alibaba Cloud) went GA, 31 new AI-specific savings scenarios across Azure OpenAI and GCP Vertex AI, a predefined AI Dashboard, a guided setup checklist, deeper Kubernetes visibility with GPU and storage lenses, and a redesigned connector experience.
More clouds, more AI, more clarity — wherever your spend lives.
The May 2026 of DigiUsher releases extend a single promise: every dollar your business spends on cloud, AI, and SaaS belongs in one governed view, with one path from “I see it” to “I’ve acted on it.” We GAed three new sources of spend, doubled down on AI cost governance with 31 new savings scenarios taking total count to 200+ scenarios (all can be configured granular level of nature of workload), and went deeper on the two areas FinOps teams told us still felt opaque — commitments and Kubernetes.
Three new connectors went GA: Anthropic, Databricks, and Alibaba Cloud - All in FOCUS Schema
DigiUsher now ingests usage and cost data from Anthropic, Databricks, and Alibaba Cloud alongside the rest of the estate. Anthropic spend — every Claude call across every workspace — flows in via a single admin API key. Databricks connects through an OAuth service principal and a SQL warehouse, so AI platform costs land in the same chargeback model as the cloud underneath them. Alibaba Cloud customers can now bring billing exports in through OSS with a few RAM credentials and see them normalised into FOCUS alongside AWS, Azure, GCP, OCI, and Google Workspace. One platform, one cost schema, every provider you actually use — including the ones nobody else is covering yet. Finally, all in FOCUS Schema.
AI cost governance gets serious: 31 new savings scenarios
Azure OpenAI and Google Vertex AI are now first-class citizens in the savings stream. Fifteen new Azure OpenAI and Cognitive Services scenarios catch the things that quietly bleed AI budgets: under-utilised provisioned throughput units, poor cache hit rates, idle fine-tuned models, deprecated model versions still attached to billing, and deployments with zero token usage. Sixteen new GCP Vertex AI scenarios cover the same blind spots for Vector Search indexes, index endpoints, metadata stores, and Tensorboards. Each one carries a concrete dollar figure, an owner, and a path to remediation — the same workflow your team already uses for cloud and SaaS savings. AI inference spend is no longer a separate cost report your CFO can’t reconcile — it’s a tracked, attributable, optimisable line item. All of the saving scenarios continue to follow the same pattern - granular configuration per product, application, workload to reflect TRUE savings all time and governed workflow automation through your preferred choice of AI, RPA or DevOps saving lots of money and 1000s of hours.
A predefined AI Dashboard built around unit economics
The new AI Dashboard gives FinOps practitioners and AI platform leads a purpose-built starting view: AI/ML totals, trends, top services, top regions, top resources, and — most importantly — unit economics widgets for the metrics your business actually cares about (cost per token, cost per request, cost per GPU-hour). Sub-cent rates render at the right precision rather than collapsing to “$0.00” — small thing, but the difference between a useful chart and a useless one. Every AI initiative gets a board-ready cost story on day one, without anyone writing a query.
A guided setup checklist so no one stalls on day one
First-time accounts now see a Setup hub that walks them through the four steps that turn DigiUsher from “installed” into “useful”: connect a data source, invite the team, create a perspective, create a dashboard, set up cost pools. Steps that need data — Pools, Unit Economics, dashboards — stay locked until a source is connected, so no one wanders into a configuration screen with nothing to configure. A dashboard widget mirrors progress, and a sidebar callout points new admins back to whatever’s unfinished. Faster time-to-value for every new customer and every new internal team rolling out FinOps.
Commitments get their own perspectives and dashboard widget
Saved filters — what we call perspectives — now apply to the Commitments page itself, so “all production Savings Plans” or “all expiring Reserved Instances in EMEA” is one click away on every visit. A new custom-dashboard commitments widget puts that same slice into any executive view. Commitment health is now something you can pin to a dashboard rather than reconstruct from a spreadsheet every Monday.
Kubernetes gets GPU and storage cost lenses
Kubernetes spend is no longer just CPU and memory. A new resource lens switcher inside the Kubernetes view exposes GPU and Storage alongside the existing CPU & Memory view, with per-workload, per-namespace, and per-cluster figures. Persistent Volume costs land as real catalog-priced FOCUS rows — pro-rated hourly and tied to a stable identifier so a volume’s cost trail survives bind, release, and re-bind cycles. New structural filters let platform engineers slice the dashboard by cluster and namespace without scrolling through hundreds of pods. And a long-standing irritation — total spend changing depending on which grouping you picked — is gone: totals are now group-invariant, with infrastructure idle bucketed cleanly. Container, GPU, and storage waste finally show up in the same place your FinOps team already works.
Connector setup rebuilt around the customer
The Add Connection experience has been redesigned end-to-end. A new full-page wizard walks customers from provider → configure → confirm without ever squeezing the form into a side panel. Each provider opens its own dedicated page with a persistent setup guide beside the form: numbered steps, a one-click Terraform download, and a deep link to the right docs page. AWS gets a Set up with CloudFormation option that launches directly into the AWS console — no copying templates. Infrastructure-as-code support now spans OCI, Databricks, and Google Workspace alongside the existing providers, and the search-able provider picker means finding the right card is a keystroke, not a scroll. The fastest, least-frustrating connector experience in the FinOps category — for the teams who don’t live in DigiUsher every day.
A clearer name for the most-loved workflow
What we used to call “Recommendations” is now Savings. Every page title, breadcrumb, tooltip, and dialog reflects what the workflow actually does: surface money you can save, and let you act on it. Less jargon, more clarity — for the new user who shouldn’t have to guess what “Recommendations” means.
A more consistent filter experience across the product
Cost Explorer, Chargeback, Radar (anomalies), and the new Kubernetes dashboard all share a unified filter pattern: edits buffer locally, commit on Apply, reset cleanly with Clear. No more accidental refetches on every checkbox toggle, no more confusion about whether a tweak has taken effect. Power users get faster, calmer exploration; new users get a UI that behaves the way they expect.
Quieter under the hood — but you’ll feel it
Some of the biggest wins this sprint are the ones you’ll never see directly. Kubernetes data ingestion is 40% faster on the metrics path and 80% faster on storage. AWS account enrichment for customers with hundreds of S3 buckets dropped from twenty-one minutes to under two. Database failovers no longer cascade into surfacing errors. Cost Explorer queries that hit million-row cardinality now degrade gracefully with a clear “Results truncated” message instead of timing out. Higher availability, faster dashboards, and a quieter pager — across the board.
What this all moves the needle on
Taken together, the last four weeks pushed DigiUsher’s reach further and the path from insight to action shorter. There are more places we can govern your spend — Anthropic, Databricks, Alibaba — and more savings to find inside what we already governed, particularly across AI inference. The product is now easier for a whole team to use, not just the one analyst who set it up. And the workflows that mattered most — commitments, Kubernetes, savings, dashboards — got materially deeper without getting harder. See every dollar. Catch every saving. Bring every teammate. In one platform.
Frequently Asked Questions
What did DigiUsher release in May 2026?
DigiUsher’s May 2026 product update added three new data source connectors in GA — Anthropic, Databricks, and Alibaba Cloud — bringing the platform’s coverage to every major cloud, every major managed AI platform, and key SaaS providers in a single FOCUS schema view. The release shipped 31 new AI-specific savings scenarios: 15 covering Azure OpenAI and Cognitive Services (PTU utilisation, cache hit rate, idle fine-tuned models, deprecated model versions, zero-token deployments) and 16 covering GCP Vertex AI (Vector Search indexes, index endpoints, metadata stores, Tensorboards). A predefined AI Dashboard launched with unit-economics widgets for cost per token, cost per request, and cost per GPU-hour. A guided Setup checklist now walks first-time accounts through connecting a data source, inviting the team, creating a perspective, building a dashboard, and configuring cost pools. Kubernetes gained GPU and Storage resource lenses, real Persistent Volume cost as catalog-priced FOCUS rows, structural cluster and namespace filters, and group-invariant totals. The connector wizard was rebuilt as a full-page hub-and-spoke flow with persistent per-provider setup guides, a CloudFormation deploy option for AWS, and expanded Terraform support for OCI, Databricks, and Google Workspace. The user-facing label “Recommendations” was renamed to Savings across the product. Anomaly and tagging-violation email alerts went into general availability with deduplication, throttling, and readable formatting. Filter UX was unified across Cost Explorer, Chargeback, Radar, and Kubernetes around a buffered Apply/Clear pattern. Performance improved across the board: Kubernetes ingestion 40–80% faster, AWS S3 enrichment from ~21 minutes to ~2 minutes for high-bucket-count tenants, and graceful degradation on million-row Cost Explorer queries.
How does DigiUsher’s Anthropic integration work, and why does it matter for AI FinOps?
DigiUsher’s Anthropic connector — finally went GA — ingests Anthropic API usage and cost data via a single Admin API key (the sk-ant-admin prefix), normalises it into the FinOps Open Cost and Usage Specification (FOCUS) format used by every other data source on the platform, and lands it in the same focus_expenses schema that powers chargeback, unit economics, and savings recommendations. The significance is that AI spend in enterprise environments is fragmented across multiple providers — Anthropic, OpenAI via Azure, Google Vertex AI, AWS Bedrock, Databricks ML, Snowflake ML — and each provider exposes cost data in its own format. Without a unified ingestion layer, FinOps teams must run a separate cost report per provider, which makes cross-provider model selection, agent-chain attribution, and CFO-level AI cost reporting effectively impossible. By bringing Anthropic costs into FOCUS-formatted storage, DigiUsher allows the same allocation rules, the same chargeback breakdown, and the same unit-economics formula (for example, cost per agent run) to apply uniformly across every model and every provider. The connector supports both new connections via POST and partial updates via PATCH, so administrators can rotate credentials without re-creating the data source. Account identification is fetched automatically via Anthropic’s organisation API, eliminating manual lookup. For enterprises deploying multiple foundation models — typical for any organisation running both customer-facing chat applications and internal agentic workflows — Anthropic governance in DigiUsher closes a coverage gap that has, until now, required either a custom data pipeline or accepting that AI spend would remain partially unattributable.
How does DigiUsher govern Azure OpenAI and Google Vertex AI cost natively?
DigiUsher’s May 2026 release added 15 native Azure OpenAI / Cognitive Services savings scenarios and 16 native GCP Vertex AI scenarios, bringing the platform’s AI inference governance to coverage parity with the cloud infrastructure scenarios it has shipped for years. The Azure OpenAI scenarios run at two scopes: six are account-scoped (covering subscription- and resource-group-level governance signals such as service-wide PTU underutilisation, broad deprecated model exposure, and account-level cache configuration), and nine are deployment-scoped (covering individual model deployments and surfacing issues such as low cache hit rate, idle fine-tuned deployments, deployments running deprecated model versions, and deployments with zero token usage over the observation window). Real dollar savings figures are calculated using a Foundry Models pricing helper that resolves SKU-specific PTU and pay-as-you-go rates. The Vertex AI scenarios cover the Vector Search surface area that quietly bleeds budget at scale: six Index-level scenarios, five IndexEndpoint scenarios, three MetadataStore scenarios, and two Tensorboard scenarios. Two new FIND_PRODUCTS calculators back the Vertex AI savings logic, supported by a dedicated Vector Search pricing helper. Three new normalised metrics — DATAPOINT_COUNT, CURRENT_REPLICA_COUNT, and REQUEST_COUNT — feed the scenario evaluators. Both provider sets surface through the same Savings stream a FinOps analyst already uses, with the same severity, status, owner, and remediation workflow. Combined with the previously shipped AWS Bedrock scenarios and the new Anthropic connector, DigiUsher now offers a single optimisation surface across the four largest enterprise AI inference platforms.
What is a unit-economics dashboard for AI, and how does the predefined AI Dashboard implement it?
A unit-economics dashboard for AI is a view that expresses total AI inference cost in terms of the business metrics that finance and product leaders actually use — cost per active user, cost per transaction, cost per token consumed, cost per inference request, cost per GPU-hour — rather than in raw provider billing line items. The reason the distinction matters is that AI spend at enterprise scale is rarely interpretable in absolute terms: a $400,000 monthly Vertex AI bill is meaningful only when divided by the number of customer interactions, model invocations, or revenue events it supported. DigiUsher’s new predefined AI Dashboard, released in May 2026, ships nine widgets that combine the standard cost overview surface (totals, trends, top services, top regions, top resources, pricing categories) with three dedicated unit-economics widgets — cost per token, cost per request, cost per GPU-hour — that render dynamic per-unit cards based on the blended rate across the dashboard’s filtered cost slice. A precision-aware formatRate function ensures sub-cent rates render at sufficient decimal places to avoid the common “displayed as $0.00” failure mode that makes per-token figures unusable in fine-grained model comparison. The dashboard is available at a stable URL (/custom-dashboards/ai), so it can be linked from a CFO report, embedded in an executive briefing, or shared as the single source of truth for AI spend across multiple foundation models and multiple provider relationships. The AI Dashboard works in conjunction with DigiUsher’s Unit Economics V2 engine — released in May 2026 — for organisations that want bespoke per-business-unit definitions beyond the blended rates the dashboard renders by default.
How does DigiUsher’s Kubernetes cost lens handle GPU and storage spend?
DigiUsher’s Kubernetes view — released as a first-class tab in May 2026 — was extended in May 2026 with GPU and Storage as dedicated resource lenses alongside the existing CPU & Memory view, available through a lens switcher at the top of both the Expenses and Rightsizing surfaces. The GPU lens surfaces per-workload, per-namespace, and per-cluster GPU-hour consumption, GPU utilisation efficiency, and identifies GPU-attached pods that are running below an actionable utilisation threshold — which is the most common waste pattern in production ML workloads and the hardest to catch from cloud billing alone, because GPU spend lands as instance-hour billing on the node rather than as workload-attributed cost on the pod. The Storage lens treats Persistent Volume cost as a first-class line item: each Persistent Volume Claim binds to a Persistent Volume whose underlying disk (EBS, Azure Managed Disk, GCP Persistent Disk) has a known catalog price per gibibyte-month, and DigiUsher’s May release lands that cost as a real FOCUS-formatted row inside focus_expenses — pro-rated hourly — using a stable pv:<pv_name> key so the cost trail survives the bind → released → re-bound cycle that normally fragments PVC attribution across reporting periods. Structural filters on the Kubernetes dashboard now allow platform engineers to scope the entire view to specific clusters or specific namespaces with include and exclude semantics, eliminating the need to scroll through hundreds of unrelated workloads to find the team’s own services. Total spend numbers are now group-invariant — meaning the same cluster total appears whether the user is grouping by Namespace, Pod, Cluster, or Workload — with infrastructure idle costs explicitly bucketed into an “Infra idle (unallocated)” row in finer-grained views so the arithmetic remains transparent. Together, these changes give platform engineering and FinOps a unified, attributable view of every dimension of Kubernetes cost — compute, GPU, storage, and idle — in the same workflow as the rest of the technology estate.
What changed in DigiUsher’s connector experience in May 2026?
DigiUsher rebuilt the connector experience end-to-end in May 2026 around a single goal: eliminate setup friction for the teams who connect a new data source once a quarter rather than every day. The previous experience presented the Add Data Source form inside a cramped right-hand sheet that competed with the underlying screen for attention; the new experience is a full-page hub-and-spoke wizard in which the provider catalog acts as the hub, each provider card opens a dedicated page at /data-sources/create/:type, and the configuration flow follows a clear three-stage progression: Provider → Configure → Confirm (with provider-specific stages for SKU Pricing on Google Workspace and Setup on Kubernetes). A persistent per-provider setup guide sits beside the form throughout the flow, presenting numbered steps for what the customer needs to do in their own cloud console, a one-click Terraform download button, and a deep link to the corresponding DigiUsher documentation page — addressing direct customer feedback that “people get stuck during setup” because they couldn’t see the instructions and the form at the same time. For AWS specifically, the wizard now offers a Set up with CloudFormation option that opens the AWS console with a pre-populated CloudFormation template URL, allowing direct one-click stack deployment without copying templates between tabs. Infrastructure-as-code coverage was expanded beyond AWS to include OCI, Databricks, and Google Workspace, and the Azure copy was refined to specifically reference the “Reader access” role the integration requires (eliminating a common ambiguity where customers granted overly broad permissions out of caution). The provider picker became searchable rather than scrollable, which matters in a catalog that has now grown past a dozen sources. The DigiUsher brand was standardised in casing across the entire wizard — “DigiUsher” rather than “DIGIUSHER” — and the navigation copy aligned to “Connectors” matching the existing sidebar terminology. The result is a connector experience that respects the time and context-switching cost of the people who set DigiUsher up but do not live inside it day-to-day.
Why did DigiUsher rename “Recommendations” to “Savings”?
DigiUsher renamed the user-facing label “Recommendations” to “Savings” across page titles, breadcrumbs, section headers, dialog text, tooltips, toast notifications, and pagination strings in the May 2026 release, because customer interviews and product-analytics review converged on a single finding: new users could not infer from the word “Recommendations” what the workflow actually did. “Recommendations” is technically accurate — every item in the stream is a system-generated suggestion — but it is semantically vague, and it asks the user to make an interpretive leap that experienced FinOps practitioners take for granted but first-time users do not. “Savings”, in contrast, names the outcome: a list of dollar amounts the organisation can recover, with an action attached to each one. The semantic shift reduced the time-to-first-action metric for new accounts in pre-release testing, because the page name now answers the question “what do I find here” before the user has read any of the content. Individual items in the stream are now described as a “savings opportunity” (singular) or “savings opportunities” (plural) rather than “a recommendation” or “recommendations” — a small but consistent change that propagates through every place in the product where the noun is used, including filter labels, status badges, and the empty-state copy. The rename was paired with a UX cleanup on the same surface (correcting a dual-source-of-truth bug in the status filter default and disambiguating cloud-provider chips on the Configure Savings page) so that the page received both a clearer name and a more correct underlying behaviour in the same release.
How does DigiUsher unify filter behaviour across Cost Explorer, Chargeback, Radar, and Kubernetes?
DigiUsher’s May 2026 release implemented a unified Apply/Clear filter pattern across the four screens FinOps teams spend the most time inside: Cost Explorer, Chargeback, Radar (anomalies), and the Kubernetes dashboard. The unified pattern has three properties. First, all filter edits buffer locally in the popover or panel where they were initiated — meaning that selecting three regions, two services, and a tag value does not trigger three separate expense refetches, only a single refetch when the user explicitly commits the change. Second, the commit is a single Apply button click, surfaced at the footer of the filter surface, with a count of how many edits are pending so the user can verify what they are about to apply before they apply it. Third, a Clear action resets the buffered edits cleanly — and, importantly, also cancels any unsaved drafts the user had partially entered if they navigate away or if the underlying filter context changes externally (for example, when a perspective switches or a date range moves). On the Radar (anomalies) screen, the same release additionally landed the “Filter Consistency” design that brings the canonical chip vocabulary in line with Cost Explorer and Chargeback: real checkboxes inside chip popovers, inline × clear actions on active chips, “n selected” headers, and a sort control that moved out of the chip row to a right-aligned pill so that sort and filter no longer compete for the same visual space. The cumulative effect is that a user moving between Cost Explorer, Chargeback, Radar, and Kubernetes encounters the same filtering grammar everywhere — fewer cognitive context switches, fewer accidental refetches, more time investigating the data.
What reliability and performance improvements did DigiUsher ship in May 2026?
DigiUsher’s May 2026 release shipped a cluster of reliability and performance improvements that customers experience indirectly but materially. Kubernetes ingestion moved to a single-pass streaming reader with columnar inserts, taking the metrics path from 91.5 seconds to 55.1 seconds (a 40% reduction) and the storage pass from 13.8 seconds to 2.7 seconds (an 80% reduction) — output byte-identical to the previous implementation. AWS S3 enrichment for tenants with hundreds of buckets moved from sequential to concurrent collection, taking the worst-case path from roughly 21 minutes to roughly 1–2 minutes; STS credential caching was simultaneously hardened so expired and invalid tokens are correctly classified as session-fatal rather than retried indefinitely. Database failover resilience improved across every background loop: a new safe_rollback helper recovers poisoned sessions on RDS Postgres failover (a routine sub-10-second event) instead of allowing them to cascade into hundreds of Sentry-visible exceptions, meaning a maintenance event the cloud provider classifies as a non-event no longer surfaces as an outage in DigiUsher. Cost Explorer queries on high-cardinality tenants — including one customer with 1.3 million distinct resources — now degrade gracefully: payloads larger than 10MB skip the Redis cache, queries are capped at 100,000 rows, and the UI displays a clear “Results truncated” alert so the user understands the rendered slice is bounded. None of these changes alter any feature in the product directly, but each one removes a category of failure that previously needed manual intervention to recover from.
DigiUsher in 30 min
Understand what each AI workload costs before scale amplifies the risk.
DigiUsher tracks cost per token, per inference, and per GPU hour — so your unit economics keep pace with adoption.
Book a 30-min walkthroughNo hard pitch · tailored to your stack
Continue Reading
More from the DigiUsher editorial team.
Product Update — May 2026: From Insight to Action
A wrap-up of the last four weeks of DigiUsher releases. refreshed one-click remediation using Azure DevOps, new deep cost-saving scenarios across AWS, GCP and Google Workspace, full commitment utilization tracking across all cloud providers, smarter enhanced forecasting, and a refreshed navigation built so every FinOps role finds what they need faster.
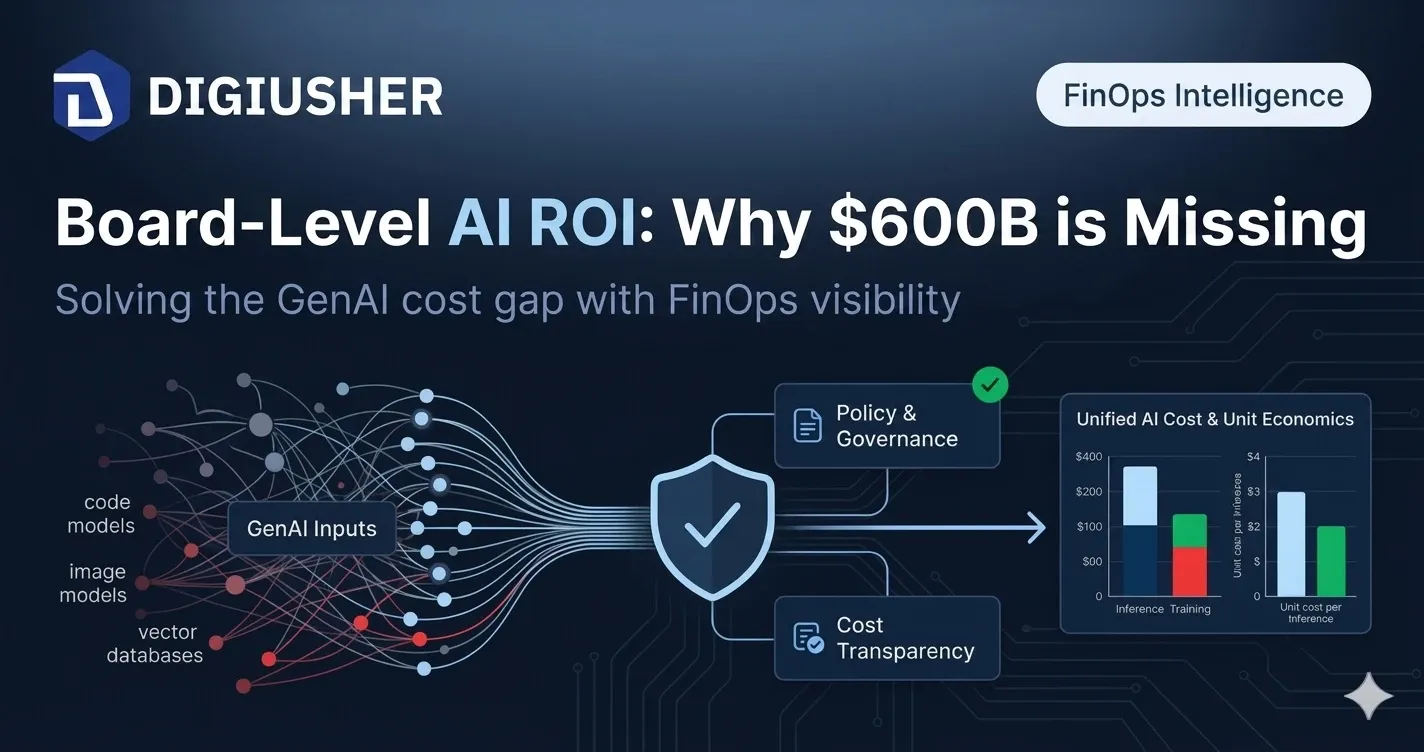
Board-Level AI ROI: Why $600B in Investment Is Delivering Single-Digit Returns — and What Fixes It
Only 7% of CFOs see high ROI from AI despite $270B in enterprise spend forecast for 2026. Here's the governance framework boards are demanding — and why cost attribution is the missing layer.
Seven Signals from the State of FinOps 2026: Why Technology Value Management Is Now a Board-Level Mandate
8% of FinOps teams now govern AI spend. Gartner forecasts $2.52T in global AI investment. The State of FinOps 2026 rewrites the rules for every CTO, CFO, and Head of FinOps.